

Introduction
Introduction
The order you already paid for
A shopper fills a basket. They reach checkout. They type in a discount code. It is rejected. And a good number of them simply leave.
That moment can be commercially expensive, and it is often under-measured. You have already paid to acquire that shopper. You have paid for the ad, the content, the email, the retargeting. They have done the hard part: chosen a product, added it to the basket, started to check out. Then a rejected discount code undoes all of it.
The instinct is to treat a failed code as noise. A typo. An expired promo. A bargain-hunter who was never going to convert. This report exists to challenge that instinct with data. Because when you look closely at what happens after a code is rejected, a failed code is not noise. It is a measurable conversion risk, and a recoverable one.
Order Rescue is built on a simple mechanism. When a shopper enters a discount code that is rejected, Order Rescue responds in the moment with a dynamically generated code that works. The question this analysis set out to answer was equally simple: does that actually bring revenue back, and what else does it tell us about the shopper?
What we analysed, and how
Order Rescue has visibility across a wider dataset of around 3 million checkout sessions across roughly 20 ecommerce merchants. Each session captured behavioural data such as checkout start time, discount code entry, order value, basket contents and whether the checkout completed.
For this report, UCL ran a deeper analysis on three of those merchants, sampled to go into detail within the time available rather than because only three were available. Together the three detailed datasets cover at least 47,753 checkout records across three distinct categories: sports and lifestyle apparel, furniture and home, and fashion. Every figure in the case studies that follow comes from these three datasets, not from the full 3 million sessions.
- Data cleaning, to find duplicates and missing records before any figures were drawn.
- Currency filtering, so every value compared is like for like.
- Status analysis, splitting checkouts into converted, missed, pending and rescued.
- Order value distribution, across low, mid and high-value baskets.
- Purchase rate and average order value (AOV) by code behaviour.
- Temporal analysis, tracking conversion and rescue patterns by day.
- Detailed analysis of the failed codes themselves, including the most common ones and how often each led to a rescue.
The three cases that follow are presented in full. Read together, they surface a handful of patterns that recur across very different businesses. We draw those threads out as we go, and again at the end.
How every checkout is classified
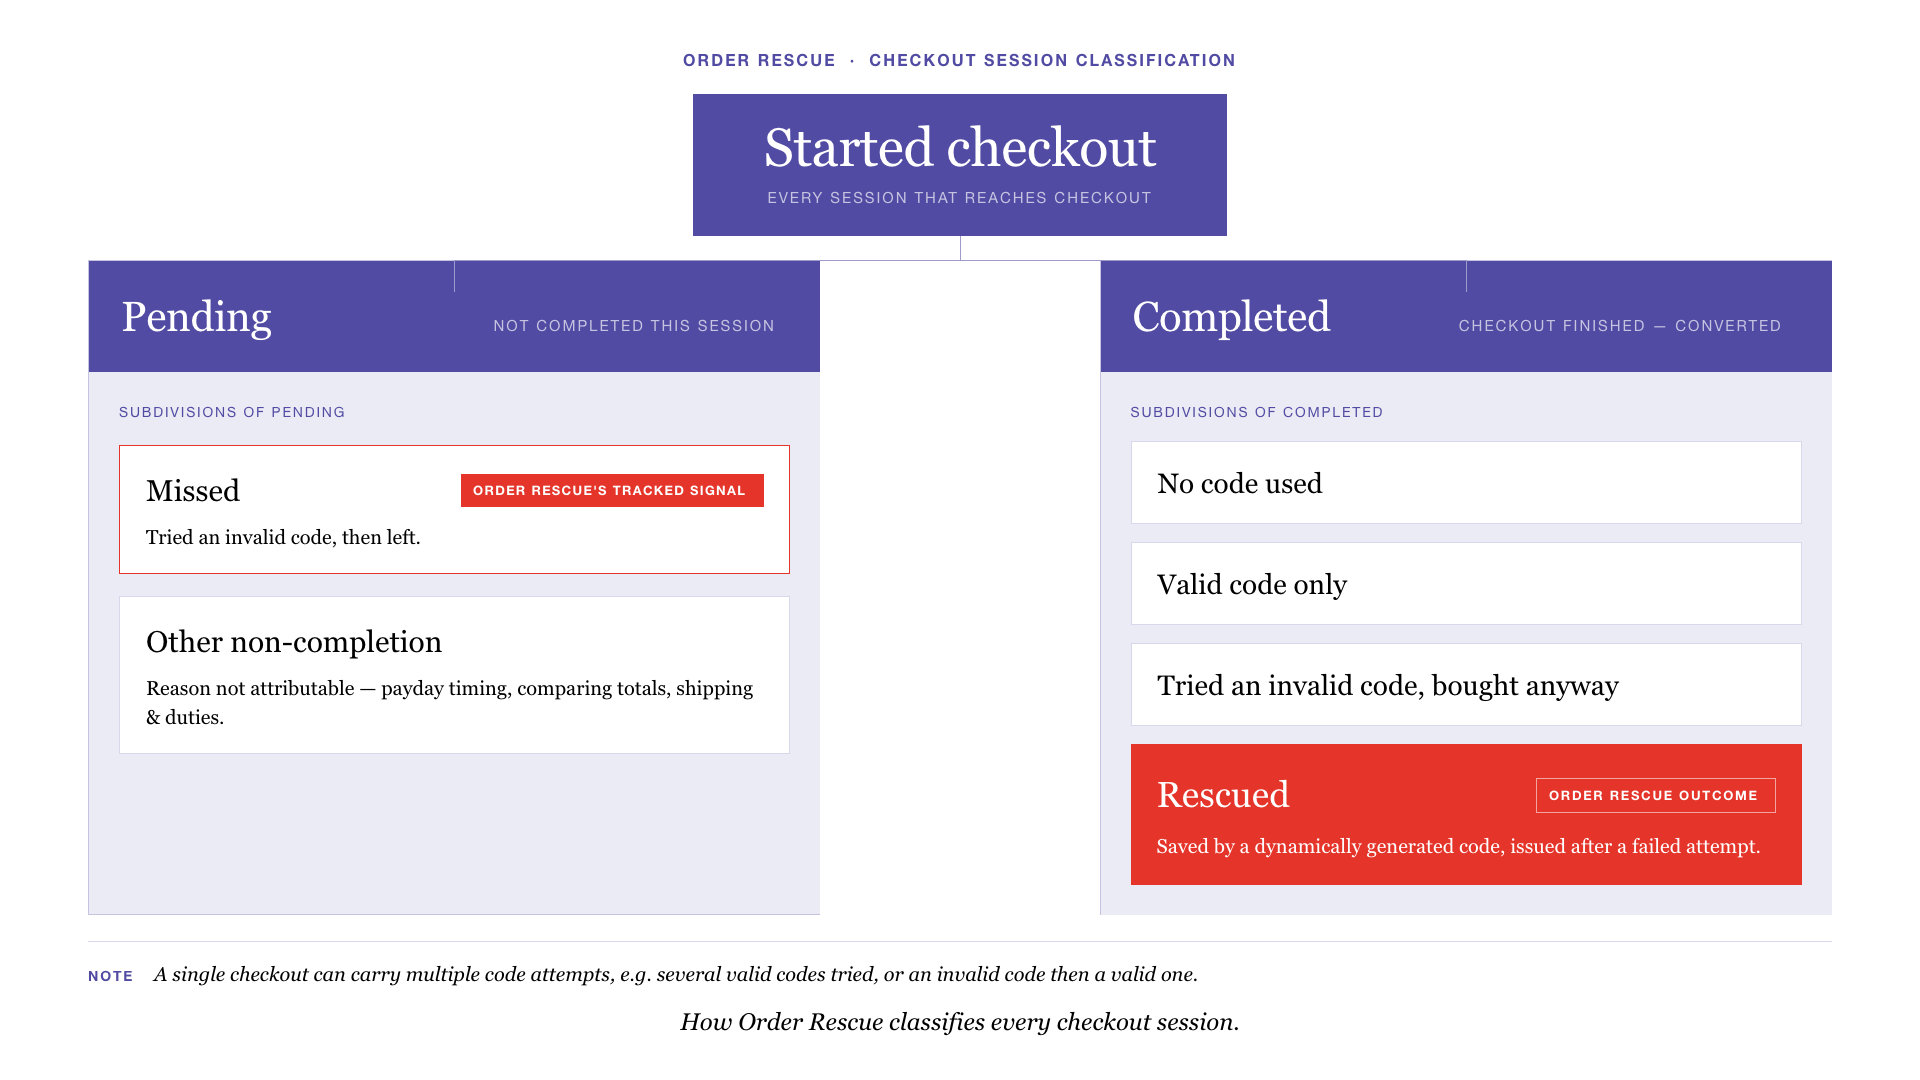
Every checkout falls into one of these outcomes. Rescued sits inside completed orders, and missed sits inside pending, rather than alongside them. The case studies use these terms throughout.
The headline numbers
Three merchants, three categories, one consistent story. The figures below are the ones that matter most. Each is unpacked in the case study that follows.
Furniture
of order value rescued in the furniture dataset, across 277 rescued orders, the largest rescued total in the analysis.
Fashion
of order value rescued in the fashion dataset, the largest dataset reviewed in detail.
Sports & Lifestyle
overall rescued rate in the sports and lifestyle dataset from June to August, representing £11,000+ of recovered order value.
Beyond the recovered revenue, the analysis kept returning to a second, quieter finding: every rescued order comes with a data trail. Which code the shopper tried, what it was worth, what day it was, how persistent they were. That trail is a layer of checkout intelligence most merchants never see. We return to it throughout.
Sports and lifestyle apparel
A UK-based sports and lifestyle apparel brand. Shopify Plus, £10M+ annual revenue.
A steady, high-volume store where more than one in seven orders was rescued, and the shoppers who tried the most codes tended to spend the most once brought back.
The shape of the data
After cleaning, the sports and lifestyle dataset held 1,036 rows, all in a single currency (GBP). The cleaning mattered: 415 duplicate records were identified and set aside before analysis, which is worth understanding at source, because duplicated values can distort figures if left in.
Status: more than 15% rescued
Total order value across the period exceeded £51,000 from June to August. Against that, the overall rescued rate, calculated as rescued orders divided by total orders, came in above 15%, representing more than £11,000 of rescued order value. Converted orders held a steady pattern with occasional peaks. Missed and pending orders fluctuated, with missed orders declining towards the end of the period. Rescued orders stayed consistent throughout.
Who gets rescued, and what they are worth
Within the rescued group, two behaviours stood out:
- 63.23% had a combination of failed codes followed by a rescue code. Their AOV was £71.08.
- 36.77% tried all code types before being rescued. Their AOV was higher, at £81.58.
The pattern is quietly telling. The shoppers who tried the most codes, the most persistent discount-seekers, were also the highest spenders once rescued. Persistence and basket size moved together.
The converted picture
Looking across all converted orders sharpened the point:
- 66.2% relied solely on valid codes, a reminder that getting working codes in front of shoppers is the first job.
- A small segment (2.42%) tried only failed codes and still converted, at the highest AOV of all: £152.10. Some higher-value shoppers will complete even when their code fails.
- 21.50% had both a failed and a rescue code, at a lower AOV of £71.51. The rescue mechanism looks especially effective on lower-value carts.
- Around 10% tried all code types, at an AOV of £105.64, above the overall average. Price-sensitive and persistent, and worth more than they first appear.
Timing
Conversion rate peaked on Wednesdays and Sundays. Rescue rates held broadly steady across the week, with slight peaks on Tuesdays and Fridays. Rescue effectiveness, measured as rescued orders over converted plus missed plus rescued on a given day, peaked on Friday and dipped mid-week on Wednesday and Thursday. Saturday stood out for the highest rate of conversions without a valid code at all.
The operational read: rescue effectiveness is not flat across the week, so there is a case for intensifying rescue strategy on the days it lands hardest.
Order value
Across all statuses, the mean order value was £84.50 and the median £65.00, with the distribution right-skewed: most orders clustered low, a few sat much higher. Split into value segments, the high-value segment carried the highest rescue rate at 15.9% (mid 14.4%, low 13.9%). Shoppers placing the largest orders were the most receptive to being rescued. Conversion rates ran higher across every segment, peaking at 43.0% for high-value baskets.
| Value segment | Records | Rescue rate | Conversion rate |
|---|---|---|---|
| High | 465 | 15.9% | 43.0% |
| Mid | 312 | 14.4% | 34.9% |
| Low | 259 | 13.9% | 40.5% |
The failed codes themselves
Some codes were rescued at a notably high rate, among them a pair of seasonal promo codes: once these failed, Order Rescue was particularly effective at converting the shopper with a valid code. At least one code showed no associated rescues. That may mean the rescue offer was not taken, or that those orders landed in the converted bucket instead.
Furniture and home
A UK-based furniture and home retailer. Shopify Plus, £10M+ annual revenue.
High-value baskets, hesitant buyers, and 277 orders completed after a rescue intervention. With rescued orders averaging £1,593.88, each one carries substantial value.
The shape of the data
The furniture dataset was clean on arrival, no de-duplication needed, and single-currency (GBP). That makes the figures unusually easy to trust.
Status: 277 rescued, against a backdrop of hesitation
The headline is stark. 468 customers tried at least one invalid code and then left without buying. Against that, 277 orders were rescued using dynamically generated codes, together worth £441,503.50 in rescued order value, the largest rescued total anywhere in the analysis. Rescued orders fluctuated but ran notably high through the latter half of June and early July, likely coinciding with promotional or seasonal activity. Converted orders stayed stable; pending orders held steady with minor movement.
Sofas are a considered, high-value purchase. Shoppers hunt for the best deal before committing, which is exactly why so many tried codes, and why the failed-code moment is so commercially loaded here.
The AOV story is the whole story
Average order value by status is where this case earns its place in the report:
| Status | Average value |
|---|---|
| Completed order | £1,151.68 |
| Rescued order | £1,593.88 |
| Missed basket | £2,347.92 |
| Pending basket | £2,866.13 |
- Completed order value (£1,151.68): shoppers who completed, with or without a valid code.
- Rescued order value (£1,593.88): orders saved by a dynamic code, sitting between converted and missed. Order Rescue enticed a genuine spread of shoppers, from basic to premium.
- Missed basket value (£2,347.92): shoppers who tried an invalid code and left. Their higher average suggests they were eyeing more premium sets, and were discouraged by the lack of a working discount. That is basket value at risk when the code fails.
- Pending basket value (£2,866.13): the highest average of all. High-consideration, high-value shoppers still deliberating.
The near-equivalence of converted and rescued volumes points to the pivotal role Order Rescue plays in the purchase journey here. And because the missed basket is worth more than £2,300 on average, the revenue at stake in each rescue is substantial.
Who gets rescued, and what they are worth
- 58.12% had failed codes followed by a rescue code, AOV £1,556.50.
- 41.88% tried all code types before being rescued, AOV £1,645.80.
As with the sports and lifestyle dataset, the shoppers who tried the most codes spent the most once brought back.
The converted picture
- 39.35% used only valid codes, AOV £1,487.89.
- 51.48% converted on failed codes only, at a lower AOV of £776.40. More than half of converters proceeded despite no working discount, at lower prices.
- 3.77% had failed then rescue codes, at the highest AOV of £1,921.76. The rescue mechanism is saving some genuinely high-value transactions.
Timing
Tuesday carried the highest conversion rate, with Monday close behind, plausibly follow-through from weekend browsing. Mid-week dipped on both conversion and rescue. Saturday saw the highest rescue rate. Rescue effectiveness peaked on Saturday before falling away on Sunday; notably, although Tuesday converted best, its rescue effectiveness was the lowest, then climbed through the week to its peak. Tuesday also carried the highest rate of conversions without a valid code, at 22.54%.
Order value
Across all statuses, mean order value was £1,878.20, median £1,248.00, mode £699.00, a right-skewed distribution with a long premium tail. The mode at £699 likely marks a popular model or recurring promotional price. By segment, the high-value band held the most orders and the highest rescue rate: 34.31%. Conversion rates ran higher again, reaching 50.8% for high-value baskets.
| Value segment | Records | Rescue rate | Conversion rate |
|---|---|---|---|
| High | 615 | 34.31% | 50.8% |
| Mid | 319 | 20.06% | 29.5% |
| Low | 311 | 0.64% | 19.3% |
Premium sofa buyers were the most responsive to being rescued of any group in this dataset. When the basket is largest, the rescue matters most.
The failed codes themselves
The top-performing failed code carried the highest rescue rate at 37.50%, with a health-themed promo close behind at 36.36%. The most-attempted code drew 539 failed attempts and still saw a high proportion rescued. Tellingly, capitalisation variants of that same code appeared among the top codes, together accounting for 682 failed attempts, a clear signal of typos or genuine uncertainty about the exact code.
That last point is a small operational goldmine. 682 failed attempts on one code and its near-variants looks less like bargain-hunting and more like friction the merchant can fix, shoppers mistyping or unsure of the exact code.
Fashion and apparel
A UK-based fashion and apparel brand. Shopify Plus, £10M+ annual revenue.
The largest dataset in the detailed analysis, a dominant home market, and more than £360,000 in rescued order value. At that scale, the failed-code opportunity stops being a rounding error.
The shape of the data
The fashion dataset was the largest analysed in detail, running to tens of thousands of records across its value segments. Cleaning surfaced a single abnormal row, which was isolated. On currency, 95.9% of transactions were in GBP, a dominant UK presence that points to strong domestic brand recognition.
Status: more than £360,000 rescued
On average, successful conversions were trending down across the timeline, and missed and rescued orders moved in consistent parallel, suggesting a systematic relationship rather than coincidence. Against that backdrop, the rescue contribution was substantial. The AOV for rescued orders was the highest of any status here, and more than £360,000 of order value was rescued. Missed baskets carried the lowest average value, but at this volume the cumulative loss from those missed baskets is still substantial. Converted and pending AOVs sat close together, meaning the revenue tied up in pending orders is significant in its own right.
Who gets rescued, and what they are worth
- 56.67% had failed codes followed by a rescue code, AOV £152.70.
- 43.33% tried all code types before being rescued, AOV £116.90.
The converted picture
- 81.84% converted on valid codes only, AOV £132.96. Valid codes do the heavy lifting.
- 3.93% converted on failed codes only, at a much lower AOV of £56.49, a more price-sensitive group.
- 7.63% used all code types, the highest spenders at AOV £150.90: persistent deal-seekers.
- Failed then rescue converters spent an AOV of £118.91. Once rescued, they were willing to spend more, the rescue code may have lifted perceived value, not just recovered the order.
- A good-plus-failed group spent an AOV of £88.18: explorers who try several codes but buy more conservatively.
Timing
Rates held relatively consistent across the week, indicating a stable Order Rescue influence day to day. Rescue effectiveness peaked on Tuesday and was weakest on Friday. Conversions without a valid code followed a similar shape to rescue effectiveness, easing off on Sunday.
Order value
Across all statuses, mean order value was £127.20, median £85.00, mode £55.00: right-skewed, with most orders lower-value but enough higher-value orders to pull the mean well above the median. By segment, the rescue rates tell a clear story:
| Value segment | Records | Rescue rate | Conversion rate |
|---|---|---|---|
| High | 21,794 | 6.54% | 65.94% |
| Mid | 12,242 | 7.91% | 57.87% |
| Low | 11,436 | 2.87% | 65.52% |
Here the pattern differs from the other two merchants. The mid-value segment carried the highest rescue rate at 7.91%, not the high-value band. The low-value segment showed the lowest rescue dependence at 2.87%: when these shoppers decide to buy, they are fairly certain and less likely to abandon over a code. Both low and high segments converted strongly, around 65%, showing the fashion brand serves budget-conscious and premium shoppers alike.
The failed codes themselves
Several codes were rescued at a high rate: once they failed, Order Rescue was effective at converting the shopper. One code that reads like a new-customer discount showed no recorded rescues, which may mean the rescue was not taken, or that those orders converted instead.
The converted-code view adds a twist. Three codes carried high conversion rates (79.0%, 67.86% and 65.86%), meaning shoppers who tried them stayed motivated enough to buy even after a failed attempt or a rescue. The highest-converting reads like a new-customer code; if it is mostly tried by new users, it may signal demand for a new-customer discount, and if none exists, that could be a gap worth closing.
Cross-cutting themes
What the three have in common
Three businesses. A £65 median basket, a £1,248 median basket, and tens of thousands of fashion orders. Different categories, different price points, different buying psychology. And yet the same patterns keep surfacing.
Rescue works across every price point
From £71 activewear baskets to £1,900 sofa orders, dynamically generated codes brought otherwise at-risk checkouts back. This is not a discount-store tactic or a luxury tactic. It held across all three.
The most persistent discount-seekers are often the most valuable
In two of the three cases, the shoppers who tried every type of code before being rescued had the highest average order values. Persistence at the discount box is not a red flag. It frequently marks a shopper worth chasing. The fashion dataset is the honest exception, where the failed-then-rescued group spent most.
Failed codes expose fixable friction, not just bargain-hunting
The furniture dataset's 682 failed attempts on a single high-frequency code and its capitalisation variants is the clearest example: this looks at least partly like fixable friction, with shoppers mistyping or guessing the exact code rather than gaming the system. The fashion dataset's new-customer-code pattern may point to new customers hunting for a discount that does not exist. Every top failed code is a note from your shoppers about what they expected to find.
High-value baskets are often the most receptive to rescue
High-value baskets were especially receptive to rescue in the sports and lifestyle and furniture datasets. The sports and lifestyle dataset's high-value segment had the highest rescue rate at 15.9%, and the furniture dataset's high-value segment had the highest at 34.31%. The fashion dataset behaved differently: its mid-value segment carried the highest rescue rate at 7.91%, while its high and low segments showed similar conversion rates of around 65%. The broader pattern is not that high-value baskets always rescue most, but that order value materially changes how shoppers respond when a code fails.
Rescue effectiveness moves by day
Every merchant showed day-of-week variation in when rescue lands hardest, Friday for one, Saturday and Tuesday for others. The specific day differs, but the fact of variation is consistent, and it is a lever most merchants are not pulling.
Implications
What this means for merchants
Order Rescue recovers revenue. That is the headline. But the data underneath it does something the recovered revenue alone does not: it hands you back the intent you were losing.
Four things Order Rescue gives you
Recovered revenue
The direct return. £441,503 rescued in one dataset, £360,000+ in another, more than £11,000 in a third. Order value that was at risk at the checkout, recovered.
Protected acquisition spend
This may help protect the acquisition spend already invested in getting shoppers to checkout. You paid to get that shopper there, and a failed code should not be where that investment quietly disappears. This is a business implication of recovered orders, not a measure of media spend from the analysis itself.
Checkout intelligence
A richer layer of checkout intelligence. Which codes shoppers try most, where typos and expired codes create avoidable friction, how rescue effectiveness shifts by day and order value, and how higher-value or more persistent discount-seeking shoppers behave when a code fails. This is hidden intent, surfaced at a commercially sensitive moment in the buying journey.
Reduced customer contacts
Fewer failed codes means fewer confused shoppers emailing to ask why a code will not apply. Surfacing which codes fail most, and fixing the typos and expired promos behind them, takes avoidable queries out of the support inbox before they are sent.
For a Shopify Plus merchant, that is four things to act on: recover at-risk revenue, protect the acquisition spend behind it, tidy up promo-code hygiene, and read customer intent at the checkout.
That is the shift this report argues for. A failed discount code is not the end of a sale. It is a signal, and a second chance. Order Rescue is how you take it.
Stop losing the orders you have already won.
Recent merchant results
From rescued revenue to measured incrementality
The UCL analysis measured the scale of revenue completed after an Order Rescue intervention. More recent merchant trials let us go a step further and answer the question a finance-minded buyer always asks: how much of that would have happened anyway? These trials compare live performance against how the same failed-code shoppers behaved with no rescue offer in place. They are Order Rescue's own live-testing results, separate from the UCL analysis.
Each example uses the merchant's own pre-trial or offer-off completion rate to estimate what would have happened without Order Rescue. The gap between that expected outcome and actual performance is the estimated net incremental impact.
Men's apparel
A deliberately cautious trigger, and failed-code completion still more than doubled inside a week.
The merchant, a large international men's apparel brand, offered a 10% discount for ten minutes once a shopper had entered three failed codes. Before Order Rescue, 40 in every 100 eligible sessions completed on their own. During the trial, 88 did, either naturally or on the rescue offer, an estimated 48 extra completed orders for every 100 comparable sessions. When the offer was switched off, completion settled back to 44%, close to the original baseline, so the uplift tracked the offer rather than carrying on without it. Across the merchant's total trading in the period, Order Rescue was estimated to add around 3.1% to completed order volume and 3.2% to revenue.
A conservative three-attempt trigger protected margin while still producing a material, measurable uplift.
Multi-market vitamins and wellness
Incrementality is not a fixed rate but something that shifts by market, and this trial shows why it has to be measured that way rather than assumed.
Tested across UK, Netherlands and USA stores with the trigger adapted per market, the trial completed 306 orders on a rescue offer. After stripping out shoppers likely to have bought anyway, around 114 of those, and roughly €9.5k of revenue, were estimated to be genuinely incremental, which at the trial run rate projects to about 244 net incremental orders and €20.4k a month. The incremental share moved market by market, because natural bought-anyway rates differ country to country, which is why a single global incrementality assumption would not have held here.
Offer configuration and the incrementality behind it both need measuring market by market, not set once as a global rule.
Home improvement
A small lift per session that still projects to close to £20k of net incremental revenue a month.
A UK home improvement merchant ran Order Rescue over a 12-day trading period and recovered 63 net incremental orders worth £7,890. At the observed run rate that projects to around 158 additional orders and £19.7k of net incremental revenue a month. The lift per session was modest, but the basket values and the volume of failed-code sessions were high enough to turn it into a meaningful monthly figure.
Even a modest lift in failed-code completion returns strongly when the volume and basket value are high.
What these results add
The trials reinforce four points from the wider analysis.
Incrementality can be measured
Order Rescue does not have to lean on gross rescued revenue as its headline proof. Comparing live performance against the merchant's own bought-anyway baseline gives a more credible estimate of the orders and revenue actually added.
Not every rescued order is incremental
The method deliberately allows for shoppers who would have purchased anyway, and the incremental share varied materially by merchant and market.
Conservative triggers still create material value
The largest measured uplift used a three-attempt trigger, reserved for shoppers showing repeated discount intent, and still added an estimated 3.2% to total merchant revenue during the trial.
Listening earns its keep before any offer goes live
Merchants can first measure failed-code volume, natural completion, basket value and abandonment, then design the offer around the evidence rather than launch on assumption.
Next steps
See what failed codes are costing you
Order Rescue can be installed in listening mode before any customer-facing offer is activated. This allows merchants to quantify the opportunity, understand which codes shoppers are trying and establish how many customers abandon or purchase anyway.
From there, a controlled rescue offer can be configured around the merchant's margin, brand and conversion priorities.
Install Order Rescue
Install in a few clicks and start collecting failed-code insight in listening mode. No offer or discount required. Available on the Shopify app store.
InstallEstimate your incremental revenue
Use the calculator to size the revenue lost to invalid codes and the upside from recovering a share of those checkouts.
EstimateBook a demo
See Order Rescue in action and discuss the right trigger and offer configuration for your store.
Book DemoA failed discount code does not need to be the end of the order. Start by measuring what happens next.